GeoFly Lab uses drone remote sensing to study how fire moves through a landscape, how it threatens homes, and how forests recover afterward. Working with CAL FIRE and the Wildfire Interdisciplinary Research Center (WIRC), we fly thermal, multispectral, LiDAR, and RGB sensors before, during, and after fire events, capturing fire dynamics that are often invisible from the ground.
1. Prescribed fire mapping
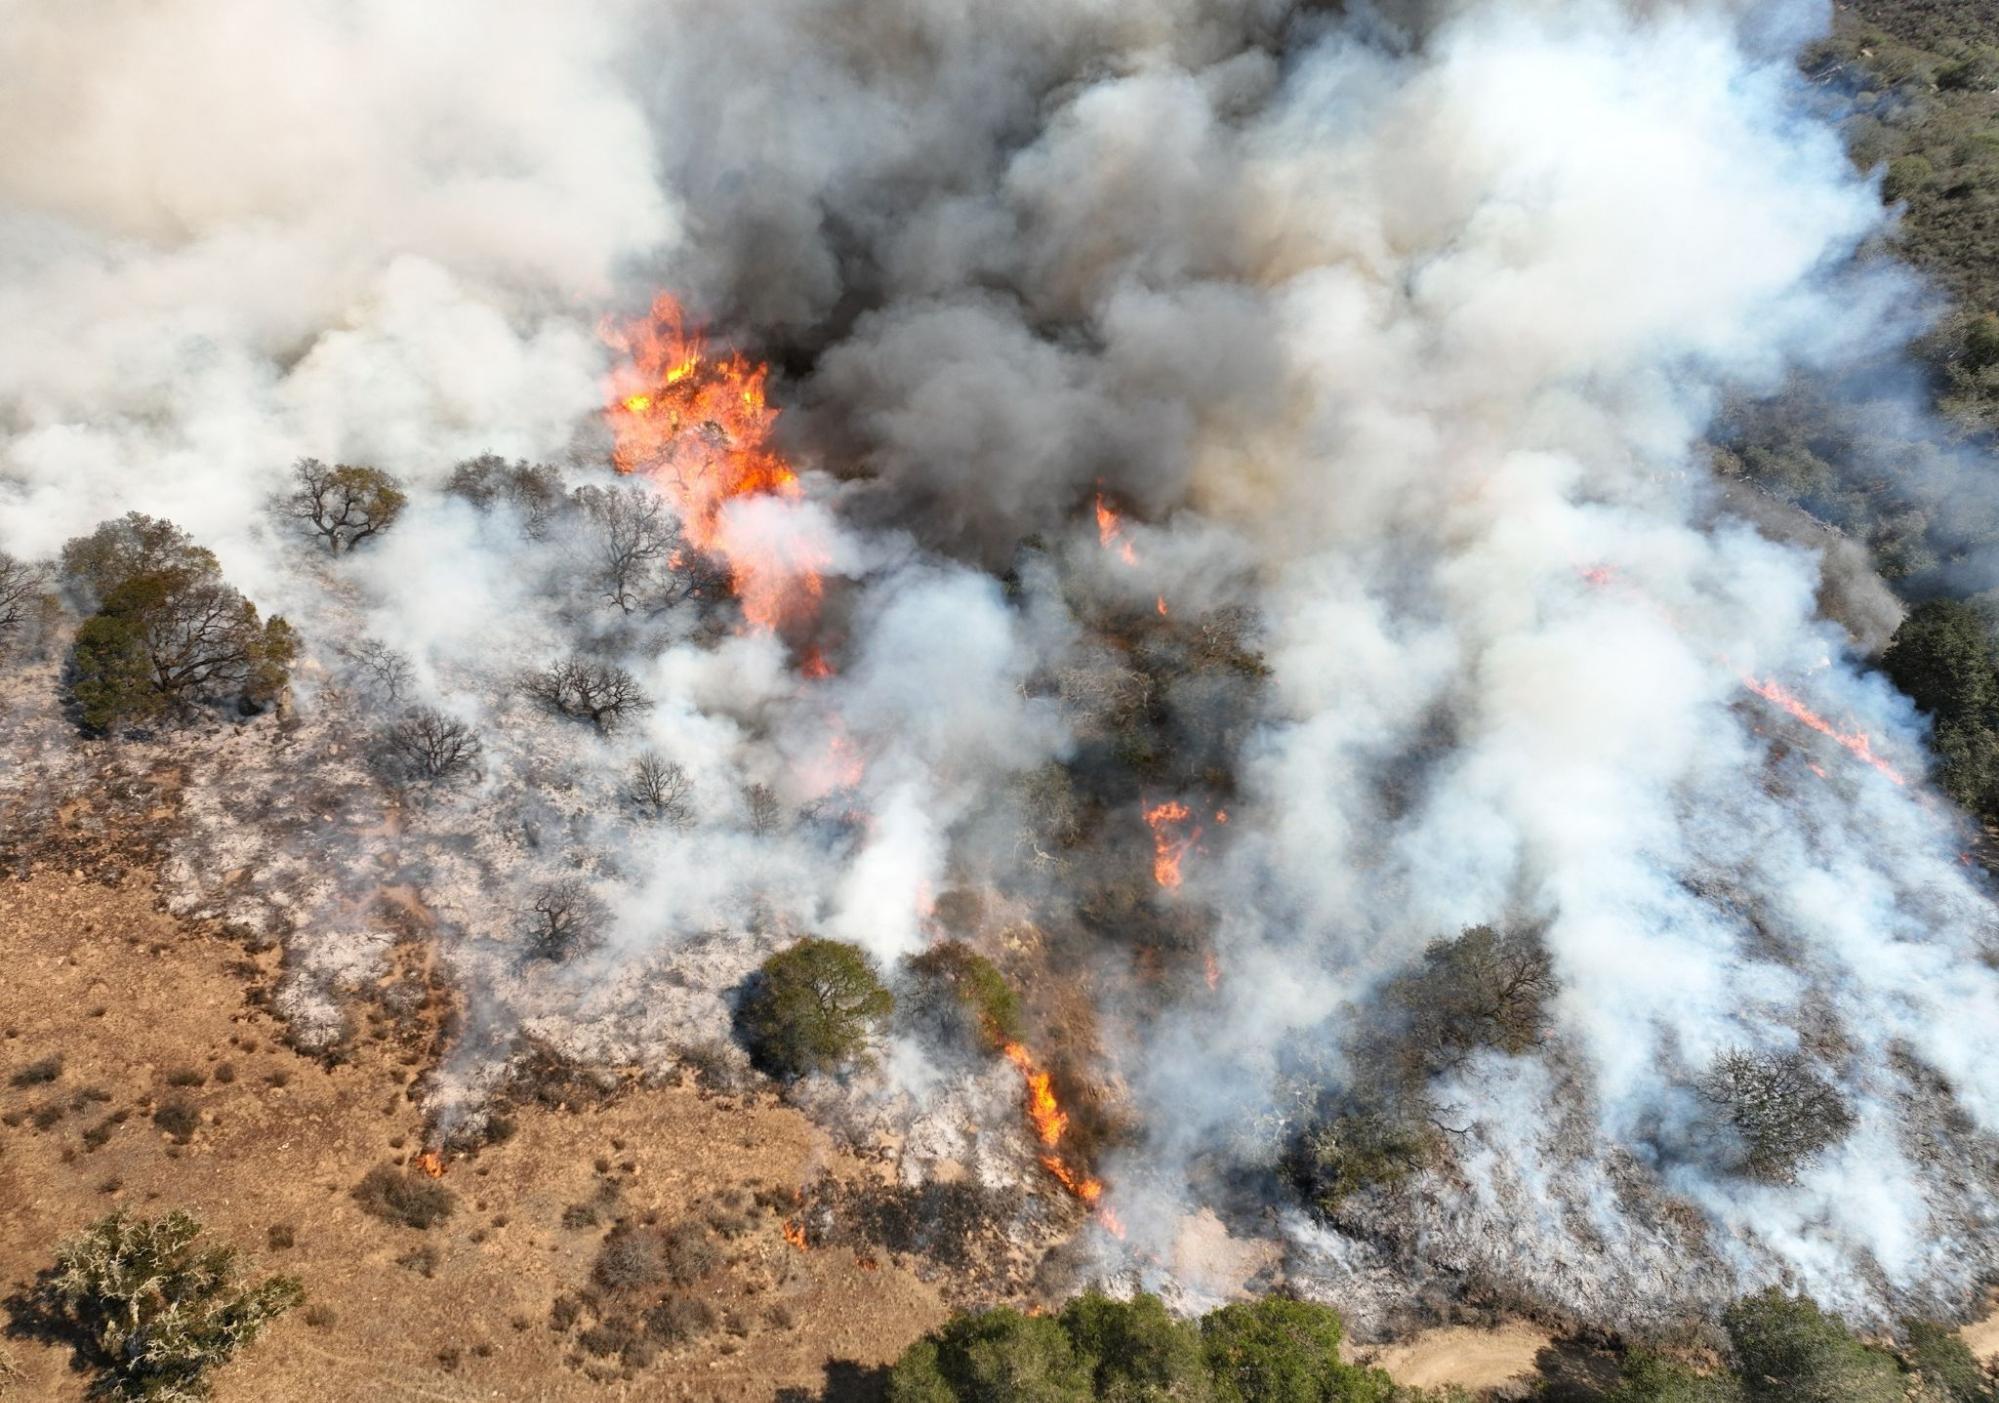
Our work on fire behavior centers on a canyon fire experiment burned on 24 October 2022. Multispectral, RGB, and thermal drone systems flew alongside airborne infrared, radar and LiDAR instruments, and ground weather-tower stations. Drone surveys bracketed the burn: multispectral and RGB imagery in July 2022, multispectral in early October, the burn itself on 24 October, multispectral and RGB again in November 2022, and a final RGB survey in April 2023. That timeline captures the site before the fire, during it, and through the following spring’s regrowth.
During the burn, a thermal drone recorded 59 minutes of continuous video of the active fire. Thermal sensors penetrate smoke that defeats both the naked eye and visible-band cameras, so the footage resolves flame intensity and rate of spread at fine spatial scales. Combined with drone-derived fuel type, elevation, and wind speed and direction, these observations feed GIS-based models that simulate fire progression and improve prediction.
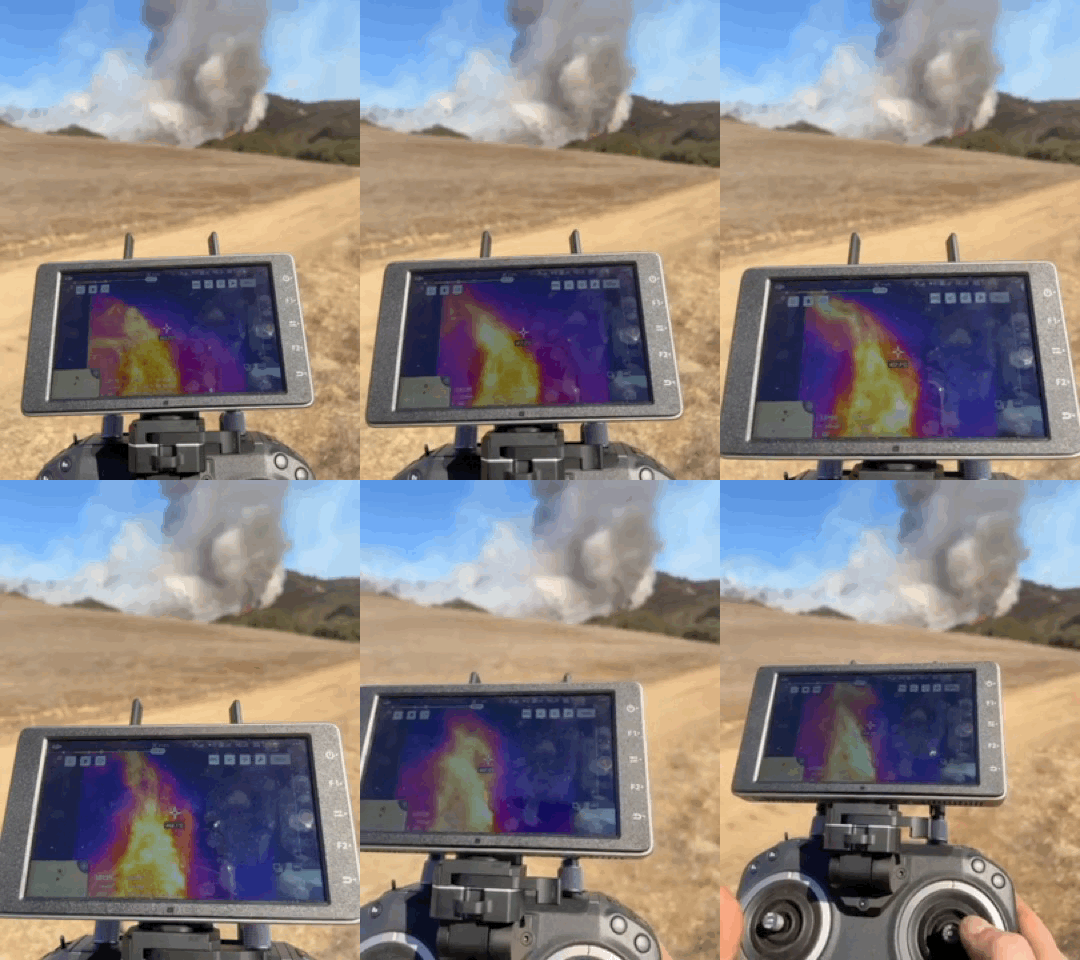
Turning that footage into data required georeferencing it frame by frame. Keyframes were extracted from the optical and thermal videos every 20 to 30 seconds and tied to the ground with roughly 15 tie points each. In the opening minutes, RGB keyframes located the flame and the drone; once smoke closed over the visible bands, the thermal keyframes were georeferenced directly. 127 keyframes were georeferenced successfully, covering 53 minutes, or 84 percent of the video.
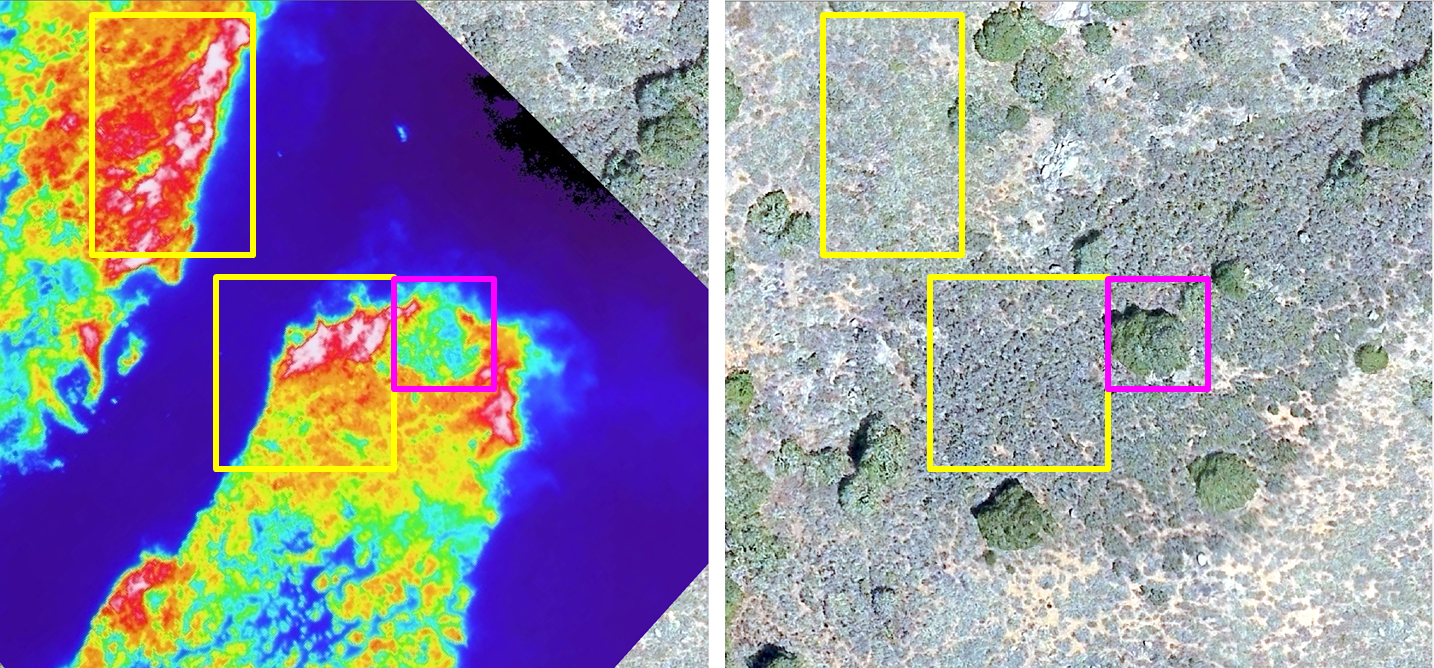
The georeferenced imagery shows how differently vegetation types burn. Oak woodland reached lower temperatures than the surrounding grass and stayed cooler after the flame front passed, suggesting a degree of fire resistance. Combined stands of black sage, Ceanothus, and chamise ignited readily and burned hot.
LiDAR and photogrammetric surveys measure what the fire consumed. Digital surface models at 0.07 to 0.10 m resolution, differenced between July 2022, November 2022, and April 2023, quantify the vegetation volume lost to the burn and the regrowth that followed. Drone orthomosaics support Anderson fuel-type classification, and we classify vegetation using Meta’s Segment Anything Model (SAM) alongside Esri supervised image classification. Multispectral bands, including near-infrared, track vegetation condition, burn severity, and recovery over time.
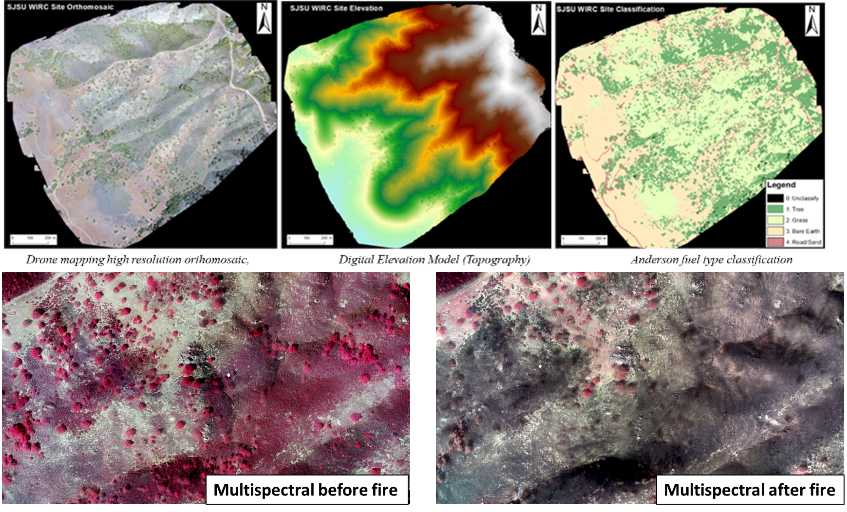
Crews on the ground often cannot see the fire front through smoke. We therefore train computer vision models on thermal drone video to detect the head of the fire automatically, giving firefighters precise, real-time information on where the fire is moving. The same archive of thermal imagery serves as training data for automated analysis of fire behavior.
Field data collection was led by Owen Hussey (M.A. Geography, 2025), and the thermal analysis was co-led by Dr. Xiangyu Ren, who applied AI and GIS methods to turn the imagery into fire-science results. The results are published in the International Journal of Wildland Fire and Drones. The study is also presented in the Canyon Fire Experiment story map, with an accompanying 3D scene of the study canyon.
2. Home Ignition Zone
The Home Ignition Zone (HIZ) project, a collaboration between GeoFly Lab and the Wilkin Fire Ecology Lab, extends earlier on-the-ground surveys of conditions around homes. Drones and remote sensing now allow wildfire risk to be assessed across whole communities, with methods that are faster, more consistent, and more scalable than traditional field evaluations. The work is integrated with WIRC, CAL FIRE, and industry mentors through the NSF Industry–University Cooperative Research Center (IUCRC) program, linking the science to insurance, utility management, and state wildfire planning.
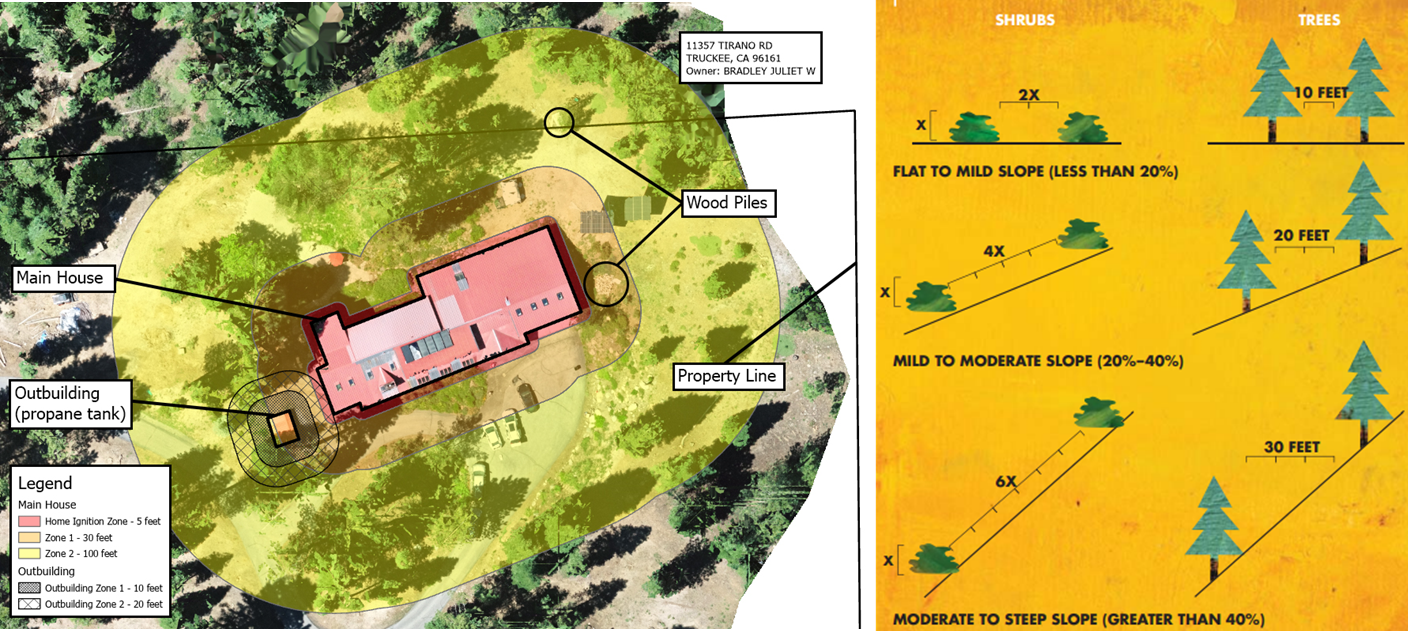
Study sites include fire-affected and high-risk communities in Paradise, Tahoe Donner, and Santa Cruz. High-resolution drone imagery and thermal data map vegetation, building materials, and potential ember pathways, and are combined with NASA satellite time series and street-level imagery for a multi-scale view of risk. Pairing these products with curbside and full-property evaluations captures details that standard defensible-space inspections often miss, such as vent mesh size or gaps in construction materials.
Community engagement is central to the project. We speak with residents about wildfire risk, home hardening, and the barriers they face in carrying out mitigation, so that recommendations are practical and specific to each community. HIZ fieldwork was led by Henri Brillon (M.A. Geography, 2025), who coordinated site evaluations and connected community surveys with geospatial data collection.
3. Post-fire recovery at San Vicente Redwoods
San Vicente Redwoods is among the most ecologically important coastal mixed evergreen forests in Northern California. Since the 2020 CZU Lightning Complex fire, GeoFly Lab and partners at WIRC, NASA Ames, and San José State University have studied how fire severity shapes forest structure, aboveground biomass, and long-term recovery.
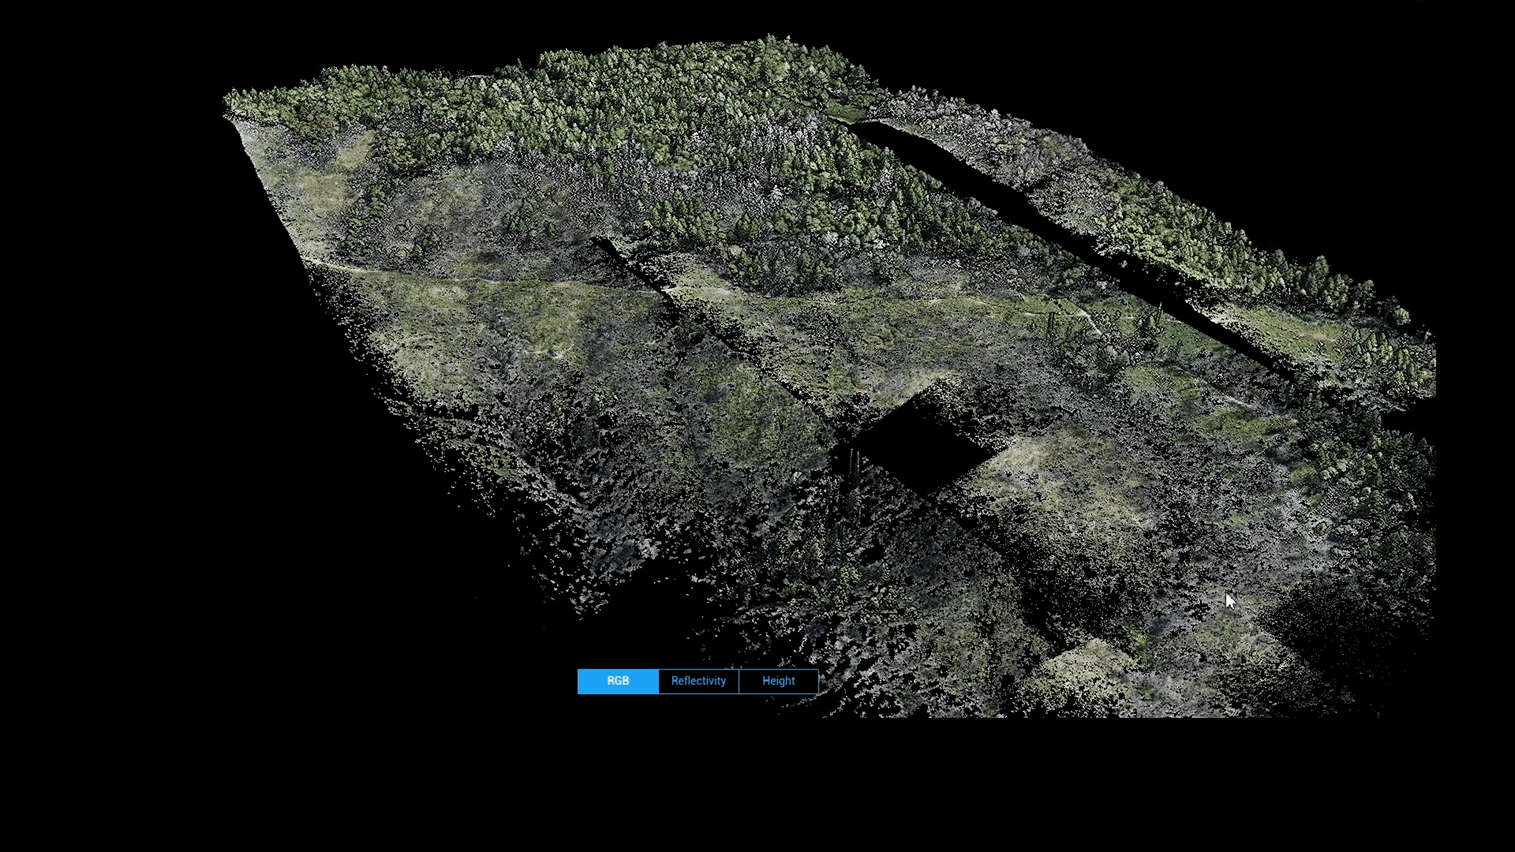
We combine satellite remote sensing, drone surveys, and Continuous Forest Inventory plot data. NASA GEDI LiDAR and Sentinel-2 imagery are used to map burn severity and to track aboveground biomass before the fire, one year after, and three years after, revealing clear links between fire severity and tree mortality. Drone multispectral and LiDAR surveys add fine-scale detail on canopy structure, allowing biomass loss to be quantified accurately and species-specific recovery to be followed: coast live oak and Douglas-fir showed high mortality under high burn severity, while tanoak and madrone resprouted differently in moderately burned areas.
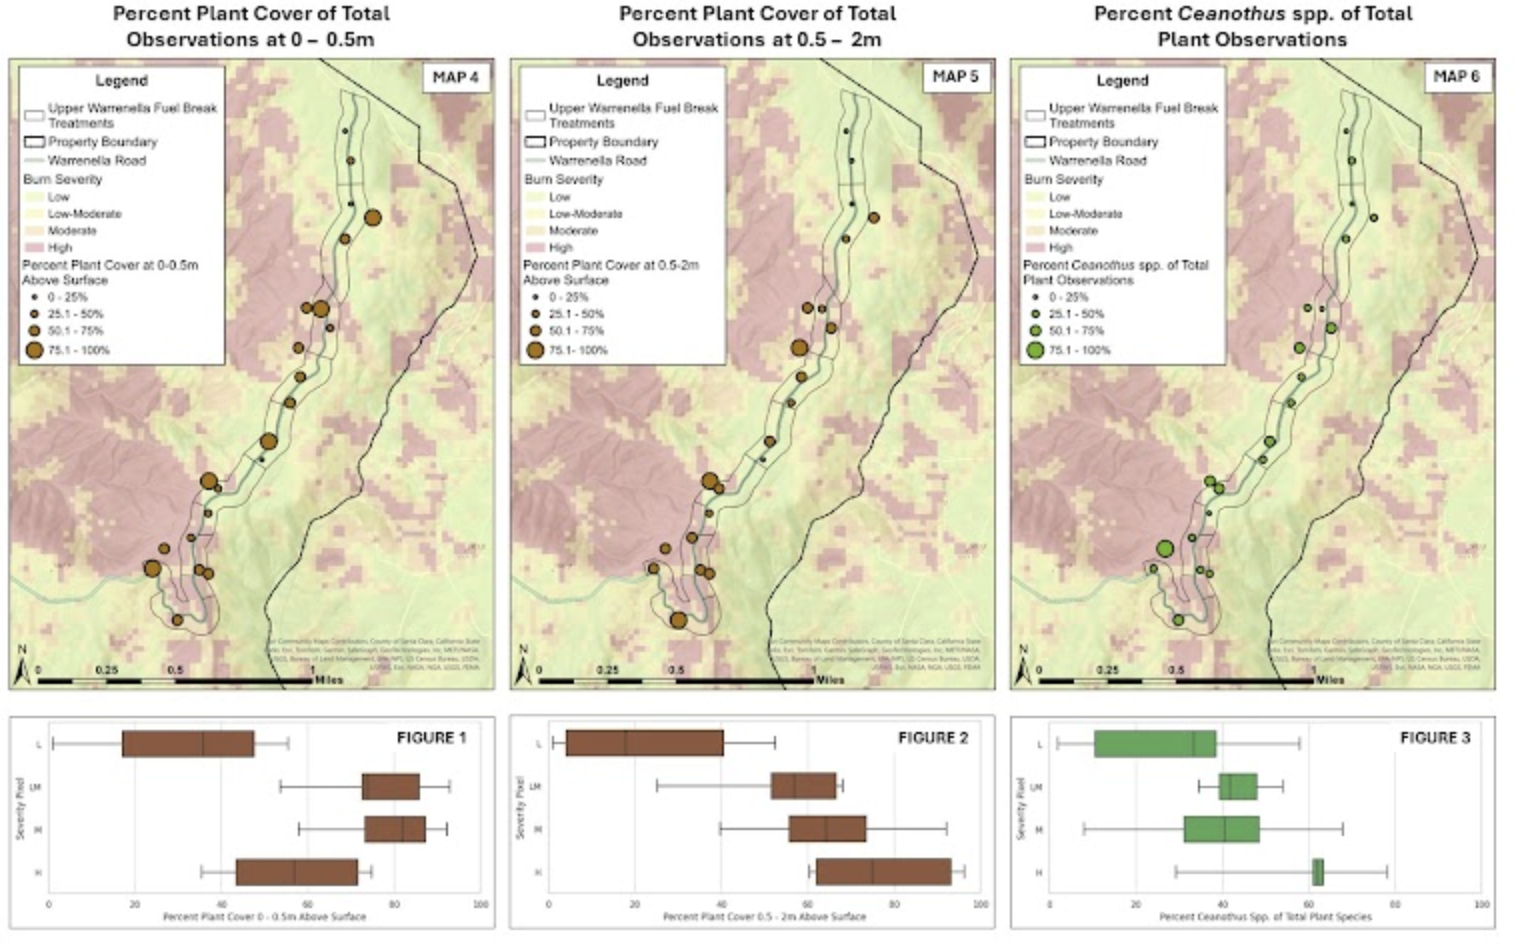
By linking field ecology, remote sensing, and fire science, this work gives land managers, conservation organizations, and policymakers the information they need for forest restoration and carbon management in the Santa Cruz Mountains. It was led by student researcher Melina Kompella.
4. Training and funding
The research is supported by NASA through the FireSage program, a paid 10-week summer internship run with NASA Ames Research Center and the Wildfire Interdisciplinary Research Center, in which students work one-on-one with NASA scientists and faculty mentors. Through FireSage, undergraduate interns and graduate researchers analyze the drone and satellite data collected at our study sites and gain hands-on experience with thermal, multispectral, and LiDAR analysis, preparing the next generation of wildfire scientists and practitioners.